Mitt. Geol.-Paläont. Inst.
Univ. Hamburg
SCOPE/UNEP Sonderband
Heft 52
S. 91-332Hamburg,
Mai 1982

Long-Term Records of CO2 Pressure Fluctuations
in Fresh Waters

by

STEPHAN KEMPE, Hamburg*)
With 94 Figures and 45 Tables
(shortened internet version without Appendix)

Contents

Abstract
92
1. Introduction and Objectives
93
2. Methods
96
2.1 Data Material
96
2.2 Geochemical Electrolyte Model of Natural Fresh Waters
97
2.3 Data Handling and Statistics102
3. Groundwater Case Study: The Carbonate/Gypsum Karst of Hainholz, South Harz,Germany104
3.1 Introduction104
3.2 Regional Geology106
3.3 Methods of Investigation109
3.4 Grouping the 31 Sample Locations According to Average PCO2110
3.5 Seasonal PCO2 Variation114
3.6 General Carbonate and Sulphate Chemistry of the Hainholz Area116
3.7 Comparing the pPCO2-Sat Calcite Relation with that of Other Areas120

*) Address of the author: Dr. STEPHAN KEMPE Geologisch-Paläontologisches Institut und Museum der Universität Hamburg, Bundesstraße 55, 2000 Hamburg 13, Bundesrepublik Deutschland


3. Groundwater Case Study: The Carbonate/Gypsum Karst of
Hainholz, South Harz, Germany

3.1 Introduction

The dominating role of dissolved CO2 in weathering and chemical erosion of continents is well established (e. g. GARRELS & MACKENZIE, 1971). However, textbooks on groundwater and karstology are principally concerned with the thermodynamics of CO2 reactions but say little on specific geological situations, namely case studies (MATTHESS, 1973; RICHTER & LILLICH, 1975; PICKNETT et al., 1976; BÖGLI, 1978).

Prior to the use of portable pH-meters and fully computerized thermodynamic electrolyte models, CO2 concentrations were often approximated by the TILLMANNS equation (TILLMANNS & HEUBLEIN, 1912):
[CO2] = K x [HCO3-]2 x [Ca ++]
(45)

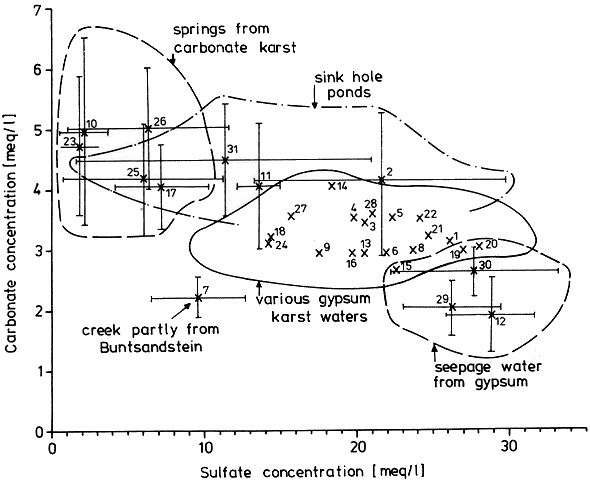
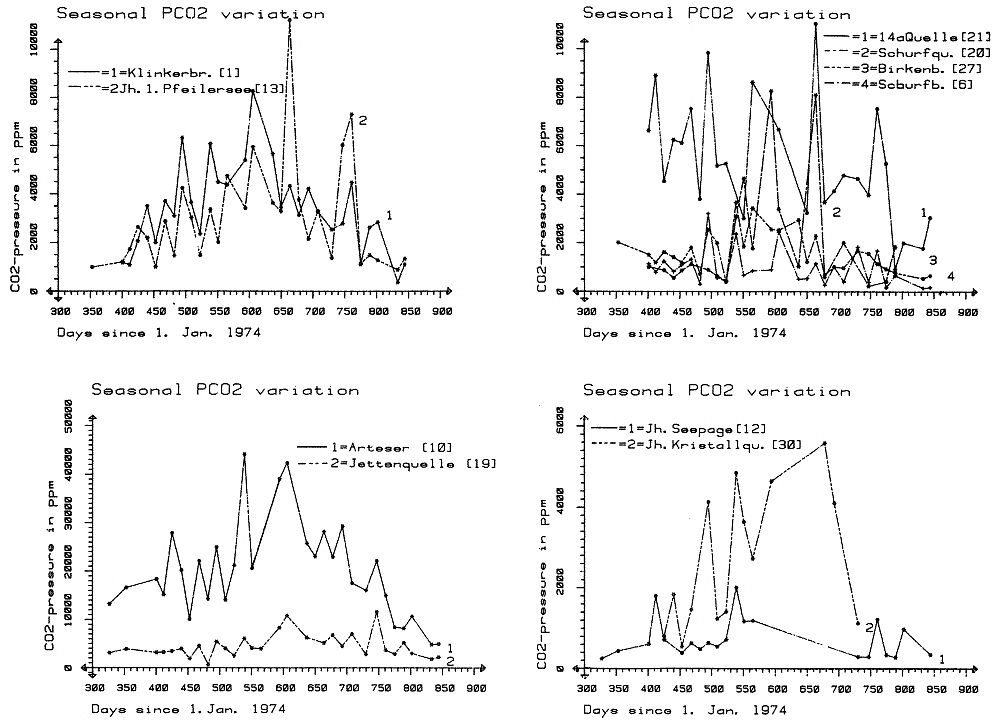
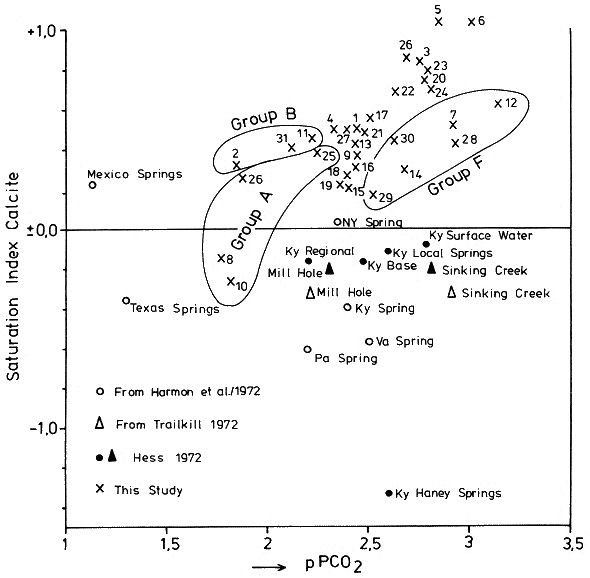
which is a measure of the amount of CO2 needed to hold a given amount of calcium carbonate in solution. The Tillmanns constant "K" is temperature dependent. To estimate the "aggressive" free CO2, that is the CO2 exceeding the amount calculated by the Tillmanns equation, a series of techniques were developed using pH-measurements or direct determination of the total free CO2 (these techniques are discussed in detail by MATTHESS, 1973).

Monitoring of small PCO2 and mineral saturation variations with time over a range of groundwater samples derived from various sources has become feasible relatively recently through the development of precise computerized thermodynamic calculations and sample evaluation. As the question of the degree of saturation with respect to carbonate minerals is especially interesting for the understanding of the geochemistry of karsts, accurate PCO2 calculations are based largely on field studies from these areas (e. g. PARIZEK et al., 1971; HARMON et al., 1972; TRAILKILL, 1972; WIGLEY et al., 1973; HESS, 1974; FLEYFEL, 1979).

Saturation of carbonate minerals was related to the type of aquifer (PARIZEK et al., 1971), for instance diffuse flow through limestone results in higher carbonate mineral saturation and mostly higher PCO2 when compared to conduit flow. In addition, mean annual temperature influences the mean PCO2 (HARMON et al., 1972).

To illustrate the effect of temperature on PCO2 we will briefly examine the region between Southern Mexico and the Northern United States where a groundwater temperature gradient of about 20° C exists. Due to higher respiration activity in the much warmer tropical and subtropical soils , the PCO2 of groundwaters differs between the two areas by a factor of 10. In Mexico PCO2 values of 30 000 ppm were measured compared to a mean of 3000 ppm in the Northern U.S. karst regions (HARMON et al., 1972). PARIZEK et al. (1971) and HESS (1974) also report substantial PCO2 variations in karstic groundwaters, due to seasonal effects.

The first comparative study of PCO2 from a variety of geologic settings in a Central European karst region was conducted by the author and co-workers in May 1973 in the Zechstein area South of Osterode/Harz, West Germany (BRANDT et al., 1976) (Fig. 2). A total of 41 water samples from gypsum-, limestone-, and nonkarstic waterbodies were analysed and the PCO2 calculated. The results showed a large scatter of values between 300 and 20 000 ppm. Due to monoseasonal sampling it could not be decided if this scatter was due to genuine environmental differences in the sources sampled or due to different phase shifts in the seasonal PCO2 curve for the individual sample locations.

To settle these questions and to obtain the absolute level of PCO2 and the magnitude of seasonal fluctuations for individual water sources a one and a half year hydrochemical monitoring was conducted in the area between November 1974 and April 1976. The results of this field experiment are presented below.


Fig. 2 Location of the groundwater investigation area in the South Harz, Germany, and schematic geological profile through Zechstein formations.

3.2 Regional Geology

Table 4
Stratigraphic table of the Upper Permian
(Zechstein) of the south-west Harz region

The upper Permian (Zechstein) salinar series of the South Harz/Germany consists of four cyclic stratgraphic units (Table 4) (HERRMANN, 1957). South of Osterode (Fig. 2), the Zechstein forms a two to three kilometer wide NNW-SSE extending outcrop. The former halite has been removed by subrosional processes. Only the anhydrite (changed partly to gypsum), limestone, dolomite, and clay formations are exposed at the surface. Uplift of the Variscian folded Harz Mountains has slightly tilted the Zechstein toward the SE. Locally, however, the earlier subrosion of the halite and the ongoing dissolution of the gypsum and carbonate series has caused much irregularity in the outcrop pattern. In addition, NW-SE and ENE-WSW striking faults disturb the stratigraphic order. Fig. 2 gives a schematic profile of the Zechstein outcrop. The A1, the Werra Anhydrite forms a prominent white escarpment which is capped by the Ca-2, the Staßfurt-, Haupt-, or Stinkdolomite which in places is covered by the up to 15 m thick T 3, the Grauen Salzton. These two formations form the Plateau of Düna. Toward the south, the intercalated A 2 or Basalanhydrite is gradually vanishing. Faults have lowered the originally up to 70 m thick A 2 or Hauptanhydrite to the level of the Düna Plateau, and by that protected this formation from becoming eroded. The Zechstein suite is buried by the steep escarpment of the lower Buntsandstein which also hides the thin beds of the Zechstein-4 or Aller-series (KEMPE et al., 1970.

The Hauptanhydrite-Karst Hainholz and a smaller outcrop toward the NW - the Beierstein - form, together with the surrounding dolomite plateau and the clay and siltstone terrain of the Buntsandstein, a perfect hydrochemical test ground within a very small area. In addition, the karst has been declared a conservation area since 1967 minimizing the influence of human activity (KEMPE, 1979 c).

The general hydrochemistry has been worked out in 1973 (Fig. 3). A morphologic water devide between the Hackenbach to the North and the Sieber to the South, straddles the area, but underground direction of karst drainage remains largely unknown. For details see BRAND et al. (1976).


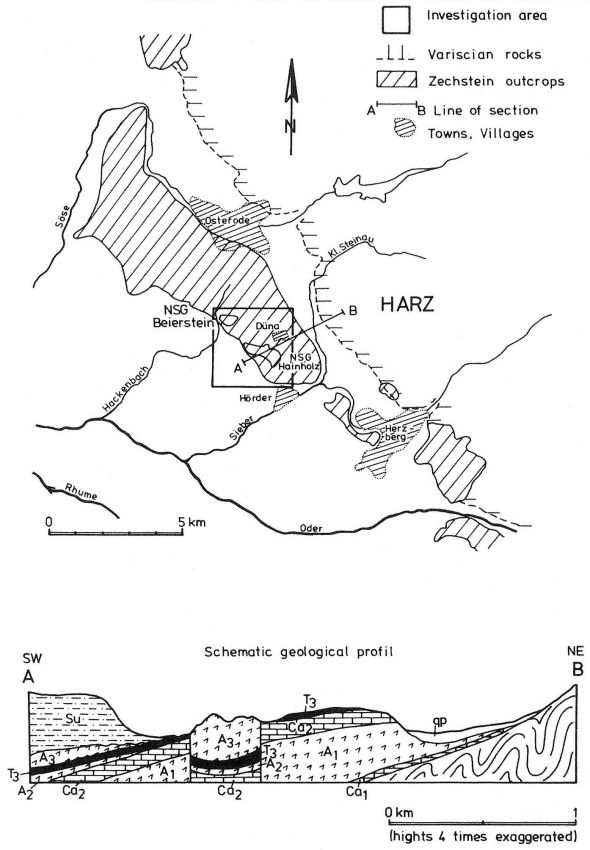
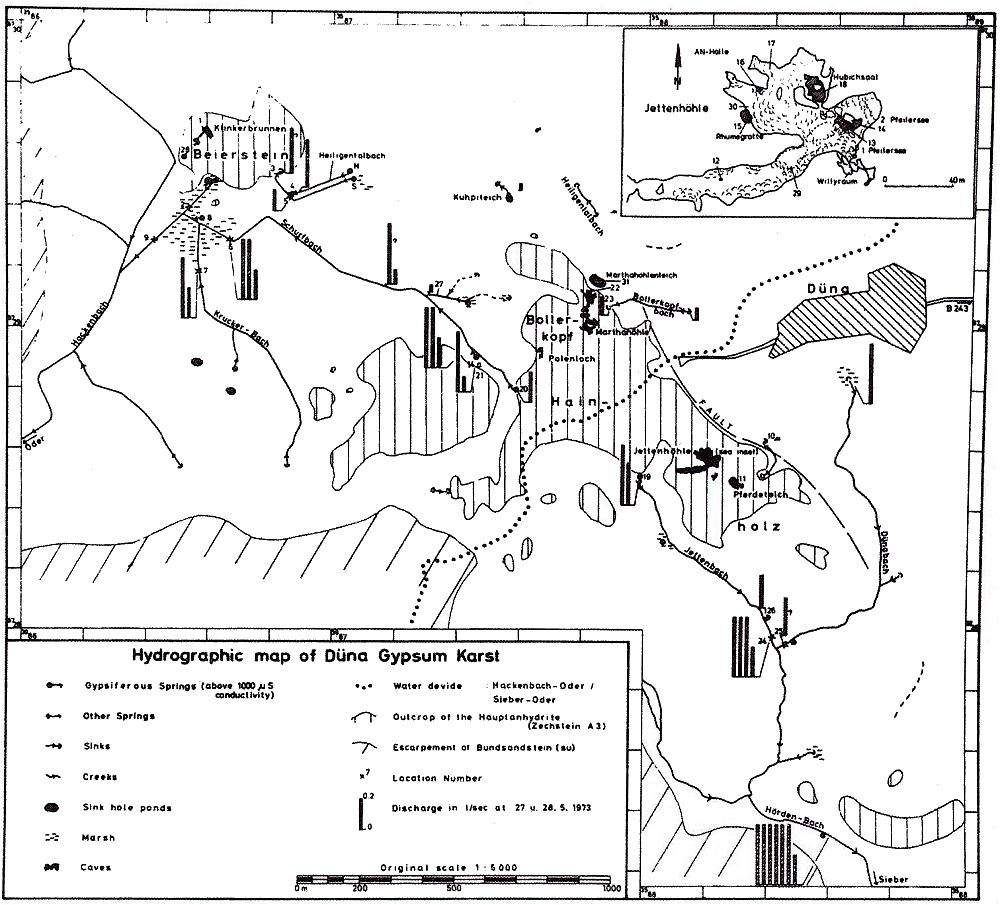
Fig. 3 Geologic-hydrographic map of the Hainholz and Beierstein gypsum karsts and the surrounding area with locations of sampling stations,
November 1974 - April 1976.

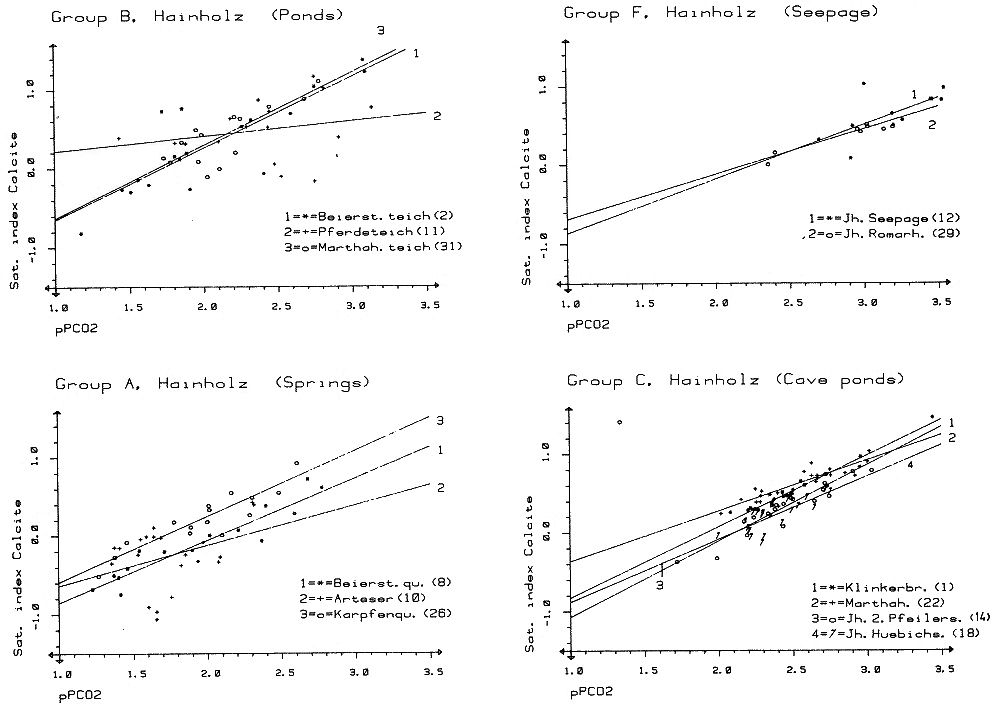
Within the gypsum beds some thirty caves are known, the largest being the Jettenhöhle (KEMPE et al., 1972). These caves develop by solution in the standing groundwater and enlarge their volume by ceiling breakdown into the groundwater outcrops (BIESE, 1931; KEMPE, 1970; KEMPE & SEEGER, 1972; KEMPE et al., 1976). These caves give direct access to the karst groundwater. Thus, not only geologically and hydrochemically titally different aquifers can be sampled from the Hainholz area but water can be collected from a varity of hydrological settings: (i) from surface creeks, (ii) from karst and subsurface runoff springs, (iii) from sinkhole ponds, (iv) from groundwater outcrops within caves and (v) from seepage water of the cave roof.

3.3 Methods of Investigation

A total of 31 sample locations were selected within the Hainholz and the sourrounding terrain (Fig. 3). Starting in fall 1974, these locations were sampled on average every fourteen days. Appendix 1 gives dates and number of samples taken and analysed. A total of 933 samples were taken during this exercise.

Temperature and pH of the water were directly measured. For pH determinations the battery powered KNICK-Portamess with analog display and temperature compensation was used in conjunction with a plastic protected INGOLD-450 combination reference pH electrode. The electrode was standardized against MERCK buffers pH 4, 7, and 9 several times during the sampling walk. The accuraty of the readings are within ± 0.05 pH.

The samples were bottled by letting the water slowly run into 100 ml polyethelene containers and closing the bottles under water without trapping any air in the bottle. The alkalinity was titrated immediately after returning to the field station. From a glass burette 0.02 n HCL was added to 20 ml sample plus 3 drops methylorange (0.1 % solution). The titration end point was a barely persisting onionred (MERCK, 1974). The burette could be read to 0.02 ml. The precision of the analyses should therfore be ± 0.02 meq/l. Following the settling of sediment matter, the total hardness was determined in 10 ml of water with a 0.1 m EDTA solution. One half to one third indicator tablet and 3 drops of 25 % NH3 were added as indicator. The titration end point was a persistant green (MERCK, 1974). The analytical precision is about ±0.01 meq/l. Some of the Ca- and Mg-organic complexes take time to disintegrade under the influence of EDTA which introduces a slight error in waters containing high Ca and Mg concentations (KEMPE, 1975 b).

Samples were stored at 4° C to be later analysed for dissolved Ca and Mg by atomic absorption techniques using lanthanium chloride as a buffer. For Ca, Mg, Na, and K is ±1.5 % (1 standard deviation). Sodium and potassium concentrations almost follow each other in all types of water; concentrations are low. Only the Dünabach (sample location 25) has a K value of 1.4 mg/l most likely due the runoff of cattle sewage from the village (not included in the mean value). The strontium concentration has a mean (61 measurements from two samples series) of 1.13 mg/l with the standard deviation of 0.65 or 57.3 %. The samples from the Heiligentalbachtal (Location 3, 4, 5) and the Klinkerbrunnen (1.28) have values of above 2 mg/l which suggests that the water of the Beierstein creek sink (Location 3) reappears in the Klinkerbrunnen.

In calculating the PCO2 and mineral saturation indices with the computer program fixed concentrations for sodium (4.2 mg/l), potassium (0.08 mg/l), and Cl (15 mg/l) were used. The program further assumes the SO4-concentration to be equal to the difference between the meq/l concentrations of (Ca + Mg + Na + K) and (HCO3 + Cl). In those cases where no Ca and Mg determination was available, the program takes the total hardness value for Ca and calculates the PCO2 without any iteration step. These CO2 values are therefore less accurate than those calculated from complete analyses.

Analytical data, PCO2, and saturation, indices for calcite, dolomite, and gypsum are listed in Tables Appendix 2-32 together with the total column statistics. The number of days starts with the first of January 1974 and the samples are identical with the numbers in Table Appendix 1.

3.4 Grouping the 31 Sample Locations
According to Average PCO2

In Table 5 all sample locations are ranked according to their respective overall mean PCO2 values. These values are closed to the mean annual values as the record of the winter 1974/75 is rather incomplete and thus prevents the means to be biased too much toward winter pressures.

Table 5
Sampling locations of the hydrochemical monitoring Nov 1974 - Apr 1976,
Hainholz/South Harz grouped according to average CO2 pressure


From group A to group F the mean PCO2 differs from 20 000 ppm to 730 ppm which illustrates the geochemical diversity of this small karst area.

Apart from thePCO2 the relation of the carbonate hardness versus the sulphate concentrations as shown in Fig. 4 is most informative for geologic interpretation.


Fig. 4 Average sulphate vs. average carbonate concentrations for 31 locations of the Hainholz/Beierstein area. Standard deviations are omitted for greater clarity in the gypsum karst water field.

Group A
Group A comprises the three PCO2 top-ranking locations 10, 8, and 26 augmented by location 25 with a somewhat lower pressure.

Sample 10 is from a 3 m deep, 50 cm wide pot-hole in a recent tuffa cone of silt sized fine calcite. The „Arteser“ discharges water derived from the agricultually used Staßfurt-Dolomite plateau of Düna. The spring is located on the North-West Hainholz fault along which the Staßfurt-Dolomite waters spill over into the Hainholz gypsum. The carbonate concentration of the Arteser is 5 meq/l and the spring carries hardly any sulphate (compare Fig. 4). The Ca/Mg ratio is 6.5 which reveals that the facies of the Staßfurt-Dolomite in this area is calcareaus. The high PCO2 of 20 000 ppm shows that the aquifer is well protected to soil air exchange. This is in accordance with the geologic situation: the Staßfurt-Dolomite plateau of Düna is at least partially covered by T 3 clay (see. Fig. 2).

The spring rapidly reacts to precipitation changes and the level of the 100 m distant sinkhole pond "Pferdeteich" (sample 11), follows the precipitation pattern with a time lack of about 10 days. Thus, the discharge from the limestone aquifer is affected at least partly by conduit flow. In spite of the high PCO2 and CaCO3 concentrations the water is generally not calcite saturated which also explains the presence of cave conduits allowing rapid water transfer in this limestone aquifer.

The locations 26 and 25 have the same geologic settings as location 10, in that they also shed water from the Staßfurt-Dolomite with high PCO2 and carbonate concentrations. Location 25 is located in the bed of a creek water admixed to it. The overall PCO2 of location 25 is therefore lower than normal for a A-Group. The sulphate content is higher in these springs, which increases the Ca/Mg ratio to over 10.

As annual mean both springs are supersaturated with calcite but not with dolomite. Individual samples, however, may show undersaturations. Due to varying proportions of creek and spring waters in location 25 the variation in PCO2 all the year round is the largest of all locations.

Location 8 is a spring in the Holocene fill of the Beiersteinteich. It is almost saturated with gypsum and slightly undersaturated with respect to calcite. The high PCO2 is most likely derived from the thick Holocene section (H.-J. WEINBERG, Hamburg, personal communication). The waters seem to be largely anoxic with substantiates this interpretation.

Group B
The second highest PCO2 value group is formed by the three ponds studied here. Locations 2, 31 and 11 are sinkhole ponds changing their volume considerably during the year, often down to total dryness.

The Beiersteinteich (Location 2) with an average pressure of almost 13 000 ppm is rather shallow with a marsh bottom (see above) and acts as a spring for sulphate karst water percolating upward through its sediments for most of the year. During very dry conditions, however, it also serves as a sink for water from the Schurfbach to the southeast causing the creek to bifurcate (F. VLADI, Osterode, personal communication).

The high PCO2 of the Beiersteinteich (Location 2) might be affected by CO2 from the dissimilation of its organic fill. The other gypsum karst waters of the Beierstein (see Map Fig. 3 for locations) do not have such high values. The Beiersteinteich is clearly influenced by respiration CO2 derived from its own waters and sediments.

Pond 22 in front of the Marthahöhle does not have any tributary. It is recharged from surface runoff and from gypsum karst water percolating from the side (Marthahöhle). The Marthahöhle has a much lower PCO2 suggesting that this pond draws its CO2 from internal respiration too.

The Pferdeteich as the sink for the Arteser - waters (Location 10) is the only one which undoubtedly receives water primarily high in PCO2. Also its coefficient of variation is low. It therefore can be ruled out that its high PCO2 is not only autorespirative in nature.

Group C
Group C includes 13 location with PCO2's between 5300 and 3000 ppm. All locations have a comparatively low coefficient of variation (Table 5). On the carbonate-sulphate diagram (Fig. 4) these locations cluster into an acra of median carbonate and middle to high sulphate concentrations derived directly from gypsum karst springs (Locations 21, 4, 19 forming the subgroup C 1) or are accessible inside the caves as pools (C 2 group).

Springs from gypsum karst have higher PCO2 than cave waters. Cave pools have larger surfaces and CO2 is constantly evading through them into the rapidly exchanged cave air. The cave pools further show considerable undersaturation with respect to gypsum. The waters encountered in the pools of the Jettenhöhle can only be derived from the underlying not-gypsiferous carbonate strata of the Platten-Dolomite (Ca 3) and Staßfurt-Dolomite (Ca 2).

No lateral water source is otherwise entering the Jettenhöhle and the seepage water is already saturated with gypsum upon reaching the karst water level (see Group F).

The Jettenhöhle seemingly owes its existence to a 'double karstification'. First the water derived from the Düna Plateau dissolved the limestone underneath the gypsum and becomes charged with carbonates. Along minor faults water upwells by buoyancy toward the water table which is within the gypsum. Water saturated with gypsum replaces the carbonate water in the lower aquifer, thus replenishing the cave pools with carbonate water. Due to the common ion effect of the calcium entering the solution by dissolution of the gypsum and due to a constant degassing of CO2, the waters become supersaturated with calcite with precipitates from the cave pool. Several meters thick cave sediments of authigenic calcite are the result (KEMPE & EMEIS, 1981). Originally the cave totally developed below the watertable until breakdown began to enlarge the ceiling into higher levels. Today breakdown material falling into cave ponds ensures further enlargement of the dome like passages.

The water flow in the underlying limestone seems to be directed toward the southeast as can be inferred from an increasing in total mean hardness and the decreasing PCO2 from the Hübichsaal (Location 18) to the Rhumegrotte (Location 15) and the Pfeilersee (Location 13). This interpretation agrees with the regional dip direction of the Zechstein. Thus, the PCO2 in these pools in a function of the rapidity with which water can sink to the lower aquifer and of the spacing of falts, i. e. of the number of opportunities for the water to upwell into the level of the gypsum karst.

The Marthahöhle (Location 22) and the Klinkerbrunnen (Location 1 and 28) seem to depend on lateral inflow of water as well. The degassed carbonate water of the Bollerkopfbach enters the Marthahöhle system sideways. Both caves have higher mean gypsum saturation than the pools of the Jettenhöhle. On the other hand, their mean PCO2 is much higher than that of the sinking creeks suggesting that these two caves derive their water from a mixture of low PCO2 sink water and very high PCO2 carbonate water from underlying limestone aquifers.

Group D
This Group comprises 8 stations from surface creeks and one gypsum karst spring (Location 20, Schurfquelle). The PCO2 range from 2500 ppm to 980 ppm with the exception of Location 9 which shows a mean of 3800 ppm.

Location 9 represents the total discharge leaving the gypsum area toward the North and toward the Hackenbach (see hydrography on Map 3). This location combines the very low PCO2 Schurfbach (Location 6) and the discharge from the high PCO2 Beiersteinteich (Location 3) and the spring of location 8, even higher in PCO2. In addition, a few meters above the sampling location 9, another spring enters the creek at its bed which appears to be high in PCO2. Thus the location 9 does not show the low PCO2 typical for the other surface creeks.

Obviously a water course of a few hundred meters is sufficient to effectively lower the PCO2 of spring waters. This is best illustrated by the Schurfbach (Location 6). This creek is fed by three individual springs: the Schurfquelle (Location 20,1600 ppm), the 14-a-Quelle (Location 21,5300 ppm) and the Birkenbachquelle (2100 ppm). Once these springs have joined their waters, just 600 meters of swift turbulent flow in a shallow creek (a few centimeters in depth, 20-30 cm wide) will de gas the water to below a PCO2 of 1000 ppm.

Also the Bollerkopfbachschwinde (Location 23) has a mean PCO2 of 2500 ppm even though it is fed by a spring from the Staßfurt-Dolomite only two hundred meters upslope, which in 1973 had a PCO2 of - 6000 ppm (BRANDT et al., 1976).

The same phenomenon is shown by the Jettenbach (Location 24) which takes its waters from the Jettenquelle (Location 19) of 4500 ppm PCO2 and the small Karpfenquelle (Location 26) with 14000 ppm PCO2. After only 600 m of flow the pressure is down to 1800 ppm. The Heiligentalbach-South creek seems to be a reappearing surface water (Location 5, 1350 ppm), which delivers water collected by field drainage pipes further upslope of the dry valley of the Heiligental.

These examples are helpful for the later discussion on the origin of the high PCO2 in large streams which have generally higher PCO2 compared to these creeks.

Group E
This group contains three sample locations of seepage water from the Jettenhöhle. The thickness of the gypsum roof is roughly 15 to 10 meter. Sample 12 has the lowest CO2 pressure of 730 ppm from all locations. The impact of the water jet on the rock floor increases sufficiently the water surface to expell all CO2. Furthermore, this sample has the highest sulphate concentration encountered. The dissolution of gypsum occurs so rapidly, that water percolating through only a dozen meters of gypsum becomes saturated. Seepage water is therefore not responsible for the formation of cavities at the water table.

In winter after snow melt, the Jettenhöhle is flooded partly with seepage water. Water extruding from the ceiling has much lower PCO2 as one would expect from the soil air PCO2 of the wood covered surface (see Location 30). Water dripping from the ceiling and releasing calcite due to slow degassing (Kristallquelle) was found to have an overall CO2 pressure of 2700 ppm.

3.5 Seasonal PCO2 Variations

All Hainholz locations react quickly to precipitation since their water storage capacity is small. They show an irregular pattern in all hydrochemical parameters in the course of the year. To determine PCO2 variations sampling would have to be conducted on a daily basis. However, most of the PCO2 time-series show quite a distinct seasonal signal. Some of these time-series are depicted in Fig. 5.

Fig. 5 Examples of seasonal PCO2 variations from the Hainholz monitoring, November 1974 - April 1976

All groups show culminating pressures about August. Minimal pressures are encountered in February-March of 1975 and February to April of 1976. There is a substantial difference between the two winters with respect to PCO2 levels. All shallow groundwaters studied in the Hainholz seem to follow seasonal changes. Minimal PCO2 values are found in late winter when the snow melt in this ares flushes the soil free of PCO2 and when respirative activity of the soil is negligible, due to low temperatures. Highest values are encountered in summer, when the water recharge to the groundwater is low, due to high evapo-transpiration and when high temperatures in the soil favour microbial activity and hence respiration in the soil. Soil PCO2 seasonal curves, as tor example found in BAKALOWlCZ (1979), GERSTENHAUER (1972), RICHTER & JACOBS (1972), and reviewed by MIOTKE (1974) show a marked seasonal cycle highly correlated with soil temperature. Soil air CO2 pressures tend to vary seasonally by at least a factor of 3 (GERSTENHAUER, 1972) to 10 (BAKALOWlCZ, 1979). In summer, pressures regularly reach values as high as 20 000 ppm. The type of soil and its porosity determine the diffusive flux transport from the soil air to the atmosphere. An increasing portion of clay in the soil will tend to increase the PCO2 of soil air (MIOTKE, 1974). Seasonal PCO2 variations of shallow groundwaters are reported from the Kentucky Karst of the Mammoth Cave ares by HESS (1974). There, the PCO2 culminates in June and minimal pressures are encountered in January-February. Compared to the South Harz the extremes of the curve occur in Kentucky about one month earlier. This is in accordance with the more southern latitude of Kentucky andits higher annualmean temperature of 14° C compared to Hainholz of about 8° C.

3.6 General Carbonate and Sulphate Chemistry
of the Hainholz Area

WIGLEY (1973a, b) has worked out the thermodynamics of the system calcite-gypsum-water and of dolomite-calcite-water under full consideration of the neutral and monovalent ion pairs between calcium, magnesium, sulphate, and bicarbonate. The computer program used (KEMPE, 1975a) in this study is analog to that of WIGLEY (1971). In case of the Hainholz with its highly mineralized waters, the inclusion of ion pairs is essential to estimate the saturation state of the water with respect to the three minerals in question. Table Appendix 33 gives an example of the relative percentages of the various ion pairs present in these gypsum waters. The saturation index of gypsum is highly sensitive to the inclusion of ion pairs in the calculation.
Only the inclusion of sulphate ion pairs leads to correct results, i. e. none of the analysed waters shows a significant oversaturation with respect to gypsum. Seepage and gypsum karst spring waters turn out to be within ± 0.1 of the saturation limit of gypsum, a margin which reflects analytical scatter.
Gypsum solutions are never oversaturated. The seepage water of Location 12 comes closest to saturation: the mean is only slightly below zero (-0.024), this is also evident from Fig. 4 where sample 12 is the most offset value on the sulphate axis.
Calcite and dolomite, on the other hand, can be oversaturated. Almost all stations have means tor the calcite saturation degree in the supersaturation range. Calcite supersaturation can be achieved by (i) temperature increase, (ii) CO2 degassing, and (iii) additional dissolution of CaSO4.
Temperature is comparatively constant throughout the groundwaters of the test area, fluctuating only one to two degrees C over the year. The effect of degassing is illustrated in Fig. 6 for two calcite solutions of 1.25 (curve 1) and 2.5 (curve 2) mmol CaCO3/l at 10° C. The pH varies linearly from 6.5 to 8.5. Within this pH regime the pPCO2 changes proportionally to the pH and the redistribution of the ion pairs is insignificant. The saturation index of calcite increases almost linearly with pH, and the regression through the sample points is close to a line with the slope of unity. In case of additional dissolution of gypsum the common ion effect of the Ca would increase the ion activity product of the CaCO3 and therefore cause an increase in the saturation index of calcite. Under closed conditions the change in pPCO2 is small. Two computerized experiments are drawn in Fig. 6 for 10° C and 1.25 mmol CaCO3 at a pH of 7 (curve 4) and for 2.5 mmol CaCO3/l at pH 7.5 (curve 3). The curves run from zero concentration of sulphate to the saturation limit of CaSO4.


Fig. 6 Experiments with the computerized electrolyte model. Graph 1: Relation of Sat. Cc and pPCO2 of a solution with 1.25 mmol CaCO3/l between pH 6.5 and 8.5 Equation of regression: y = 0.983 x X - 2.676, r = 1.000 (equilibrium pPCO2 = 2.72).
Graph 2: The same experiment with 2.5 mmol CaCO2/l. Regression equation: y = 0.976 x X - 1.834, r = 1.000 (equilibrium pPCO2 = 1.88).
Graph 3: Effect on the Sat. Cc/pPCO2 relation by adding CaSO4 from zero concentration to saturation of gypsum at 2.5 mmol CaCO3/l and pH 7.5.
Graph 4: Same experiment with 1.25 mmol CaCO3/l and at pH 7.0.
All experiments at 10° C.

Natural waters dissolving additional CaSO4 in a system closed to gas exchange therefore increase the calcite saturation steeply compared to only a slight loss in PCO2. Solutions open to gas exchange should develop along lines of slope unity or below the slope of unity when active precipitation of calcite occurs. This pattern seems to be in fact typical for the Hainholz groundwater bodies. The sat. Cc/pPCO2 relation is drawn in Fig. 7. Throughout the year these relations are linear with regression slopes of 0.9 or higher. This suggests that pressure changes (e. g. degassing) is the main process determining the composition of the water at the surface of the sampled groundwater and springs. Dissolution of gypsum, however, causes a comparatively small effect.

Several conclusions can be drawn from these data:

1) Locations with high correlation coefficients seem to receive a rather well defined parent water, whereas locations with low correlation coefficients are derived from water sources of widely differing CaCO3 contents.
2) Water bodies which show regression slopes close to one degas without precipitating much of its calcite; precipitation is highest in locations with low slopes. High slope examples are the cave waters and two of the ponds, obviously stagnant water is not the place where calcite easily precipitates even if constant degassing occurs. Low slope examples are the seepage waters and the springs. Calcite has been lost rapidly from seepage water as well as from the high pressured carbonate springs. For springs, part of the record is below saturation. Less steep slopes indicate better equilibration between a certain PCO2 and the calcite concentration dissolved.
3) The intersect of the regression with the x-axis at y = 0 reveals the pPCO2 at which this water had been in equilibrium with calcite formerly. This pPCO2 is named in Fig. 7 'parent pPCO2'.
In the Hainholz area the overall equilibrium pressure of the waters is around pPCO2 2.0 or 10 000 ppm. This figure symbolizes the PCO2 to which carbonate is saturated in the water. It is determined not only by soil PCO2 (which can be much higher) but also by the average time the water is allowed to react with the limestone. Thus it is a function of the transmissivity of the aquifer.

Fig.7 Relations of pPCO2 with saturation index of calcite for various Hainholz locations.

Lower left: group A waters
Regression equations:
parent pPCO2
1.Loc.
8
Y
=0.793xX-1.65, r=0.936
2.08
2.Loc.
10
Y
=0.514xX-1.15,r=0.355
2.24
3.Loc.
26
Y
=0.838xX-1.43,r=0.909
1.71
  Upper left: group B waters
1.Loc.
2
Y
=0.909xX-1.56, r=0.843
1.72
2.Loc.
11
Y
=0.192xX+0.0274,r=0.227 
3.Loc.
31
Y
=0.926xX-1.57,r=0.801
1.70
  Lower right: group C waters
1.Loc.
1
Y
=0.906xX-1.74, r=0.973
1.92
2.Loc.
22
Y
=0.644xX-1.01,r=0.894
1.57
3.Loc.
14
Y
=0.968xX-2.04,r=0.947
2.11
4.Loc.
18
Y
=0.800xX-1.68,r=0.791
2.10
  Upper right: group F waters
1.Loc.
12
Y=0.688xX-1.55, r=0.677
2.25
2.Loc.
29
Y=0.572xX-1.26,r=0.975
2.23

3.7 Comparing the pPCO2-Sat Calcite Relation with that of Other Areas

In Fig. 8 the mean pPCO2 values are plotted against the calcite saturation index. The samples of the Hainholz mostly group above the saturation line, which is a consequence of the ongoing addition of gypsum to the waters and of rapid degassing.
Again the overall 'parent pPCO2' would be situated somewhere around or slightly below 2.0. The reported measurements from American karst areas are all undersaturated with respect to calcite and have much lower CO2 pressures of around 2.5 pPCO2. The waters there have less time to collect CO2 from the soil air and move faster through the limestone, i. e. the regional transmissivity of those karsts are much higher. Thus not only temperature differences are responsible for regional subsurface calcite dissolution, but also the geological structure of a certain limestone aquifer.
The CO2 pressures of shallow groundwaters are highly variable according to seasonal changes in microbial soil activity and according to local geologic factors and can thus vary even in a small area by two orders of magnitude between 300 and 30 000 ppm.


Fig. 8 Comparison of pPCO2 and calcite saturation averages of the 31 Hainholz/Beierstein locations with various other karstwaters from different regions and authors.

Impressum / Datenschutz